Drag CRISIS! The Coefficient of Drag is NOT a Constant!
There’s a mystery out there. Scientists are still working exactly what it is, but it’s real. It’s proven, in theory and in practice.
This article attempts to address an area of aerodynamics and fluid-dynamics which seems to have eluded much of the Internet. I’ve searched long and hard for relevant information. There’s just not a lot out there. Even the all wonderful WikiPedia is begging for someone to update it’s pathetic 100 word explanation.
Aerodynamic drag is a serious business, whether designing ships, cars, aircraft, submarines, or baseballs.
Consider a car at highway speeds…. the majority of power your engine is producing to keep you moving is to overcome two things.
- Friction of the tires on the pavement. 4000lbs of weight on 4 tires plus gravity = slowing down real fast.
- Resistance of your vehicle to movement through the air.
One of these two things above will never change, no matter how fast you go. The other does change according to how fast you are going. Air resistance increases with the square of the speed.
At some point, the drag you have to overcome will exceed the amount of power available to you, and you will be pushing a wall of air so thick and hard, that you will never succeed in accelerating beyond it, no matter how much horsepower you throw at it.The penultimate top speed of any design is dictated by the shape and size. The more streamlined, the less drag.
Coefficient of Drag
There is a number that defines how resistive an object is to a flow. It takes a variety of things into consideration, how slippery/shiny/smooth the surface is, how sharp it is (how well air can flow around it), and how big it is relative to the stream of molecules in the flow.
One can even say it’s a number that describes how aerodynamic something is. It’s a number that starts just above 0 and can end WAY WAY up there. We call this the Coefficient of Drag. This can be used in many calculations, and remains a virtual constant, no matter how fast or slow you are going, and no matter what “fluid” you’re in.
A Honda Civic’s Drag Coefficient is 0.36. It doesn’t matter if you’re going 1km/h or 100 km/h, in air, or underwater. The form of the front of that car will always have a drag coeffecient of 0.36
This is a number that we can use to predict the opposing force of motion through a fluid at any given speed.
Knowing the drag coefficient plus the surface area (the frontal area) of the vehicle, we can determine how much opposing force there is “pressing” against the car at different speeds.
Assuming average full-size passenger cars have a drag area of roughly 8.5 ft² (.79 m²), knowing the 0.36 Cd (Coefficient of Drag), and the density and viscosity of air (about 1.2kg/cubic metre), we can use the Drag Equation to find out, in a real world measurements, how much drag a Civic actually produces traveling at different speeds.
Drag Equation
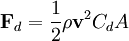
- Fd is the force of drag,
- ρ is the density of the fluid (Air is about 1.293 kg/m3)
- v is the velocity of the object relative to the fluid,
- A is the reference area
- Cd is the drag coefficient
In order to determine the density of the fluid (in this case air), we can estimate it based on temperature, pressure, and altitude. In otherwords, the Barometric Formula. For our exercise today, we will assume a cool day down by the ocean, about 1.293kg/m3.
So let’s work it for a few different speeds; 50 km/h, 80 km/h, 100 km/h, 110 km/h, 115 km/h
(1/2)(1.293)(50km/h^2)(0.36)(.79)=.5(1.293)(13.9m/sec^2)(0.36)(.79)= .5(1.293)(193.21)(0.36)(.79)=3.5524479366 kg(1/2)(1.293)(80km/h^2)(0.36)(.79)
=.5(1.293)(22.2m/sec^2)(0.36)(.79)
= .5(1.293)(492.84)(0.36)(.79)
=9.0615829464 kg(1/2)(1.293)(100km/h^2)(0.36)(.79)
=.5(1.293)(27.8m/sec^2)(0.36)(.79)
= .5(1.293)(772.84)(0.36)(.79)
= 14.2097917464 kg(1/2)(1.293)(110km/h^2)(0.36)(.79)
=.5(1.293)(30.6m/sec^2)(0.36)(.79)
= .5(1.293)(936.36)(0.36)(.79)
= 17.2163456856 kg(1/2)(1.293)(115km/h^2)(0.36)(.79)
=.5(1.293)(31.92m/sec^2)(0.36)(.79)
= .5(1.293)(1018.89)(0.36)(.79)
= 18.7337802294

As you can see, it took from approximately 0-100km/h for the first 10kg of drag force, then only100-120kph for the next 10kg of force! Before we are even beyond 200kph, we have already reached 60kg (130lbs!).
It doesn’t matter how big your engine is, you’ll never make past a certain point (OK, maybe that civic engine can be replaced with a HEMI, but even then, you’d probably only acheive an extra 10kph at best.
Reynolds Number
Here’s another beautiful number we can use. The Reynolds Number is the ratio of inertial forces to viscous forces. In other words, its a number to describe how big and fast something is, compared to the gooeyness and density of the liquid around it. This allows us to build an idea of “equivalency”, and to scale any dataset produced in a test environment (like a wind-tunnel).
Reynolds numbers tells us about “flow regimes”, and allows us to compare the similarity of flows. For example, we can state that dynamically similar aerodynamic realms involving fluid dynamics are only equal if the Reynolds Numbers are equal. NASA explains “It is possible for an experiment with a helium-filled balloon 100 cm in diameter rising in air to be dynamically similar to a 9.60 cm plastic ball falling in water if the Reynolds Numbers are the same.”
Typically, when we find what Reynolds Number we are looking at, we express it as either a number (50,000) or a factorial expression (5x 10^4).
Here’s some examples of Reynolds flow regimes:
Probably one of the most studied elements in fluid-dynamic studies is the sphere. A sphere is easy to scale, and it’s surface is uncomplicated and perfectly smooth. This makes it an ideal candidate to use in our Reynolds number demonstration.
Drag Crisis
The Reynolds number (R), for a baseball is calculated using R=vd/υ. Where the diameter (d) of the baseball is (7.32 cm), v is the velocity relative to air, and υ is the kinematic viscosity of air (about 0.000015 m2/s at 20 C) 6. So the greater the velocity becomes the greater the Reynolds number. A drag crisis occurs when the laminar flow of air in a boundary layer near the ball begins to separate and becomes turbulent. The effect that the turbulence in the boundary layer causes will actually reduce the size of the turbulent wake behind the ball, and reduce the drag force. The drag crisis produces a regime where the aerodynamic drag force actually decreases as the velocity increases.
Links
http://www.brianhetrick.com/casio/tbb1exapumdrg.html -Calculator Programming Tutorial – this was the ONLY broken out equation I saw on the whole internet.
http://www.aerospaceweb.org/question/aerodynamics/q0215.shtml – Golf ball dimples – excellent ideas for reducing drag.
http://www.uam.es/personal_pdi/ciencias/agrait/nico_archivos/docencia/fisica%20de%20fluidos/Life%20at%20Low%20Reynolds%20Number,%20EM%20Purcell%201973.htm – life at Low reynolds Numbers – Excellent read about how things like sperm and cellular life makes motion in the liquid concrete around them
http://en.wikipedia.org/wiki/Density_of_air – Density of Air
http://www.economicexpert.com/a/Drag:equation.htm – A reasonable quick and dirty explanation of the drag equation.

HI . Can you calculate the theoretical top speed of my 2007 Honda Civic sports? (2lt motor) Australia model
Thank you, have a nice day
I found this post a little late but still, I have 2 points:
First off, you’re about 1m^2 out with your frontal area estimate. An average small car will have a frontal area around 2m^2, give or take. In your calculation of drag – the density of air at sea level in standard atmospheric conditions (15 degrees, 1013mbar) is 1.225kg/m^3. Force in SI units should really be in Newtons, not kg.
Secondly, the title of your post says that drag coefficient is not constant, and then in your text you say that the Civic will always have a Cd of 0.36. This is a contradiction – your title is correct. At low speed the drag coefficient of the Civic will be higher than 0.36, because the Reynolds number is lower. The Civic will most likely not undergo a true drag crisis in a normal range of driving speeds like a sphere might, but the Cd value will vary a bit through the speed range as various separation regions on the car change shape due to the boundary layer state or thickness. Most probably you would see a Cd closer to 0.4 at say 40 or 50kph, maybe a bit higher, falling to 0.36 at around 80 or 90kph and staying there until the car hits its top speed. Some cars capable of much higher speeds will experience some variation in Cd up to 200 or 300kph, and more modern wind tunnels such as Audi’s can measure Cd values at speeds of up to 300kph for this reason (and also to check the lift balance at higher speeds).
If you’re interested in learning more about this, I strongly recommend Barnard’s book “Road Vehicle Aerodynamic Design: An Introduction” – it’s no more technical than what you’ve written above, and it explains a lot more about aerodynamic drag and lift of cars and how to improve it. Much better than Wikipedia!
I’m late on this one as well. Phil is quite right about the variability of Cd – we all know that it does: it just doesn’t generally vary that much in the range of vehicle speeds that we are interested in. I’d like to add in a few comments:
1. In the automotive industry we are concerned about drag because of its influence on fuel economy (and hence CO2 emissions) and high-speed performance. In the latter case this is clearly a high (post-critical with respect to the classic drag crisis) Re situation. The former is about a relatively long-time average of speed (cruising). Generally, this happens at reasonable speed. When we test cars (I work with Saloons and SUVs mostly) we see very little variation between 50 km/h and 100 km/h (our usual test speed. At this speed Re will be in the range 106 to 107). Variations are of the order of 0.005, or less, in Cd.
2. At practical road speeds we have very little (perhaps even no) laminar boundary layer -so boundary layer transition is of little relevance. Many (depending on the vehicle) of our separation lines are geometrically fixed; also gaps, seals, finishers etc act to ‘trip’ the boundary layer. Aside from maybe a small region around the bonnet (hood) leading edge radius we don’t really see laminar oundary layers (you do see some re-laminarisation on door mirror casings sometimes). The upshot of this is that we see relatively little change in flow topology in the speed range of interest. Hence Cd doesn’t vary much, as I’ve said.
3. Cd should fall slightly with speed as, for cars, the total drag force that is being non-dimensionalised by area and dynamic head comprises pressure drag, skin friction drag and a small amount of (vortex) induced drag (perhaps). Whilst the pressure drag force scales with the square of velocity the skin friction drag does not: it increases with velocity raised to a power of less than unity. Thus it is being ‘over corrected’, for want of a better term, by the velocity squared term in the denominator of the drag equation. Hence, although the force increases with velocity, its contribution to the total coefficient diminishes. However this variation in Cd will be small as skin friction drag is worth something around 5% of the total for contemporary cars; so a variation in 5% of the total will be small!
4. On the road the car will be subject to relatively large levels of atmospheric turbulence, plus turbulence generated by vehicle wakes and road-side objects. This will also ensure that the flow is post-critical and Cd will not tend to vary much during typical high-speed or constant-speed cruising.
A closing comment or two. Personally I always like to think about Cd in two ways. First it is the result of non-dimensionalising the total drag force, rather than a determinant of the drag force. Second it provides a scale for the efficiency of the shape. Of course, to compare different vehicles (or make a performance calculation) you need to look at Cd.A – size does matter to the force!
Phil’s book suggestion is excellent. The next step on is ‘Road Vehicle Aerodynamics’ by W-H Hucho.
Two more things: in the above the Re values should be 10e6 and 10e7 (I didn’t know that the comments didn’t support html). Also, never trust wikipedia on drag, Cds for vehicles and particularly for the origins of aerodynamic lift!